Case
Processing Summary
|
||||||
Cases
|
||||||
Valid
|
Missing
|
Total
|
||||
N
|
Percent
|
N
|
Percent
|
N
|
Percent
|
|
Height of respondent
|
50
|
100.0%
|
0
|
.0%
|
50
|
100.0%
|
Foot length of respondent
|
50
|
100.0%
|
0
|
.0%
|
50
|
100.0%
|
Descriptives
|
||||
Statistic
|
Std.
Error
|
|||
Height of respondent
|
Mean
|
161.6087
|
1.14640
|
|
95% Confidence Interval for Mean
|
Lower Bound
|
159.3049
|
||
Upper Bound
|
163.9124
|
|||
5% Trimmed Mean
|
161.3496
|
|||
Median
|
159.5333
|
|||
Variance
|
65.712
|
|||
Std. Deviation
|
8.10628
|
|||
Minimum
|
146.67
|
|||
Maximum
|
181.83
|
|||
Range
|
35.17
|
|||
Interquartile Range
|
12.35
|
|||
Skewness
|
.544
|
.337
|
||
Kurtosis
|
-.235
|
.662
|
||
Foot length of respondent
|
Mean
|
24.4033
|
.18853
|
|
95% Confidence Interval for Mean
|
Lower Bound
|
24.0245
|
||
Upper Bound
|
24.7822
|
|||
5% Trimmed Mean
|
24.3333
|
|||
Median
|
24.0667
|
|||
Variance
|
1.777
|
|||
Std. Deviation
|
1.33308
|
|||
Minimum
|
22.43
|
|||
Maximum
|
27.77
|
|||
Range
|
5.33
|
|||
Interquartile Range
|
1.68
|
|||
Skewness
|
1.015
|
.337
|
||
Kurtosis
|
.505
|
.662
|
||
Height distribution
Skewness=0.544>0
Height distribution is
positively skewed.
Standard error= 0.337
2 X standard error=
0.337 X 2= 0.674
0.544 < 0.674
Height distribution
resembles a normal distribution as statistic is with 2 standard errors.
Foot length distribution
Skewness= 1.015 >0
Foot length distribution
is positively skewed.
Standard error=0.337
2X standard error= 0.337
X 2=0.674
1.015> 0.674
Foot length distribution
does not resemble a normal distribution as statistic exceeds 2 standard errors.
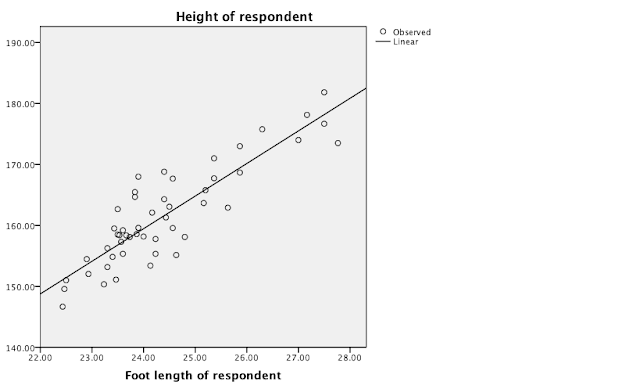
2) EXPLORING THE CORRELATION BETWEEN FOOT LENGTH AND HEIGHT AND HYPOTHESIS
TESTING
As both variables are scale measurement, Pearson's correlation coefficient is used to measure the correlation between height and foot length.
Correlation Table
Symmetric Measures
|
|||||
Value
|
Asymp. Std. Errora
|
Approx. Tb
|
Approx. Sig.
|
||
Interval by Interval
|
Pearson's R
|
.880
|
.033
|
12.808
|
.000c
|
Ordinal by Ordinal
|
Spearman Correlation
|
.816
|
.066
|
9.784
|
.000c
|
N of Valid Cases
|
50
|
||||
a. Not assuming the
null hypothesis.
|
|||||
b. Using the
asymptotic standard error assuming the null hypothesis.
|
|||||
c. Based on normal
approximation.
|
|||||
From the table,
Pearson's Correlation
Coeffcient = 0.880. This indicates a strong positive relationship between the
height and the foot length of person.
N= 40, p <0.05:Null hypothesis is rejected.
3) REGRESSION EQUATION
Model
Summary
|
|||
R
|
R
Square
|
Adjusted
R Square
|
Std.
Error of the Estimate
|
.880
|
.774
|
.769
|
.641
|
The independent variable is Height
of respondent.
| |||
Coefficients
|
|||||
Unstandardized
Coefficients
|
Standardized
Coefficients
|
t
|
Sig.
|
||
B
|
Std.
Error
|
Beta
|
|||
Height of respondent
|
.145
|
.011
|
.880
|
12.808
|
.000
|
(Constant)
|
1.027
|
1.827
|
.562
|
.577
| |
So,
LINEAR EQUATION:
Foot length = (0.145 X Height)
+ 1.027
